MS Access
Need Help in MS Access Assignment?
We can help you if you are having difficulty with your MS Access Assignment. Just email your MS Access Assignment at admin@assignmentcache.com.
We provide help for students all over the world in MS Access Assignment
-

Microsoft Access 2010 Chapter 3 Lab 2 Maintaining the Walburg Energy Alternatives Database
$20.00Microsoft Access 2010 Chapter 3 Lab 2 Maintaining the Walburg Energy Alternatives Database
Problem: The management of the Walburg Energy Alternatives recently acquired some items from a store that is going out of business. You now need to append these new items to the current item table. You also need to change the database structure and add some validation rules to the database.
Use the database modified in the In the Lab 2 of Chapter 2 on page AC 134 for this assignment. You also will use the More Items database from the Data Files for Students. See the inside back cover of this book for instructions for downloading the Data Files for Students, or see your instructor for information on accessing the required files.Perform the following tasks:
Learn More
1. Open the More Items database from the Data Files for Students.
2. Create a new query for the Item table and add all fields to the query.
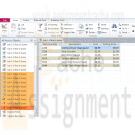
3. Using an append query, append all records in the More Items database to the Item table in the Walburg Energy Alternatives database, as shown in Figure 3 – 87.
4. Save the append query as Walburg Append Query and close the More Items database.
5. Open the Walburg Energy Alternatives database and then open the Item table in Datasheet view. There should be 20 records in the table.
6. The items added from the More Items database do not have a vendor assigned to them. Assign items 1234 and 2234 to vendor JM. Assign item 2216 to vendor AS. Assign items 2310 and 2789 to vendor SD.
7. Create an advanced filter for the Item table. The filter should display records with fewer than 10 items on hand and be sorted in ascending order by Description. Save the filter settings as a query and name the filter Reorder Filter.
8. Make the following changes to the Item table:
a. Change the field size for the On Hand field to Integer. The Format should be fixed and the decimal places should be 0.
b. Make Description a required field.
c. Specify that the number on hand must be between 0 and 50. Include validation text.
d. Add a calculated field Inventory Value (On Hand*Cost) following the Cost field. Format the field as currency.
9. Save the changes to the table design. If a dialog box appears indicating that some data may be lost, click the Yes button.
10. Add the Inventory Value field to the Inventory Status Report. Place the field after the Cost field. Save the changes to the report.
11. Specify referential integrity between the Vendor table (the one table) and the Item table (the many table). Cascade the update but not the delete.
12. Submit the revised More Items database and the Walburg Energy Alternatives database in the format specified by your instructor. -

Microsoft Access 2010 Chapter 5 Lab 1 Adding Fields and Creating Multitable Forms for the ECO Clothesline Database
$25.00Microsoft Access 2010 Chapter 5 Lab 1 Adding Fields and Creating Multitable Forms for the ECO Clothesline Database
Problem: ECO Clothesline needs to maintain additional data on each sales rep. The company needs to add the date each rep started as well as notes concerning the sales rep and a picture of the sales rep. The company wants a form that displays sales rep information and the customers for whom they are responsible.
Instructions: If you are using the Microsoft Access 2010 Complete or the Microsoft Access 2010 Comprehensive text, open the ECO Clothesline database that you used in Chapter 4. Otherwise, see the inside back cover of this book for instructions on downloading the Data Files for Students, or contact your instructor for more information about accessing the required files.
Perform the following tasks:
Learn More
1. Add the Start Date, Notes, and Picture fields to the end of the Sales Rep table. Save the changes to the structure of the table.
2. Add the data shown in Table 5 – 2 to the Sales Rep table. Adjust the row and column spacing to best fit the data. Save the changes to the layout of the table.
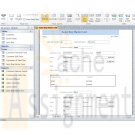
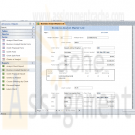
3. Create the form shown in Figure 5 – 87. Use Sales Rep Master Form as the name of the form and Customers of Sales Rep as the name of the subform. Users should not be able to tab through the Picture control. The title is centered with a font size of 24 and a font weight of bold.
4. Query the Sales Rep table to find all sales reps who started before January 1, 2012, and who have computer skills. Include the Sales Rep Number, First Name, Last Name, and Notes fields in the query results. Save the query as Computer Skills Query.
5. Submit the revised database in the format specified by your instructor. -

Microsoft Access 2010 Chapter 5 Apply Your Knowledge
$25.00Microsoft Access 2010 Chapter 5 Apply Your Knowledge
Reinforce the skills and apply the concepts you learned in this chapter.Adding Date/Time and OLE Fields, Using an Input Mask Wizard, and Querying Date/Time Fields
Instructions: Start Access. If you are using the Microsoft Access 2010 Complete or the Microsoft Access 2010 Comprehensive text, open the Babbage CPA Firm database that you used in Chapter 4. Otherwise, see your instructor for information on accessing the files required in this book.
Perform the following tasks:
Learn More
1. Add the Start Date and Picture fields to the Bookkeeper table structure, as shown in Figure 5 – 84. Create an input mask for the Start Date field. Use the Short Date input mask type.
2. Add the data shown in Table 5–1 to the Bookkeeper table.
3. Query the Bookkeeper table to find all bookkeepers who started after January 1, 2012. Include the Bookkeeper Number, First Name, Last Name, Hourly Rate, and Earnings YTD in the query results. Save the query as Start Date Query.
4. Submit the revised database in the format specified by your instructor. -

Microsoft Access 2010 Chapter 4 Lab 2 Presenting Data in the Walburg Energy Alternatives Database
$25.00Microsoft Access 2010 Chapter 4 Lab 2 Presenting Data in the Walburg Energy Alternatives Database
Problem: The management of Walburg Energy Alternatives already has realized the benefits from the database of items and vendors that you created. The management now would like to prepare reports and forms for the database.
Instructions: If you are using the Microsoft Access 2010 Complete or the Microsoft Access 2010 Comprehensive text, open the Walburg Energy Alternatives database that you used in Chapter 3. Otherwise, see your instructor for information on accessing the files required in this book.Perform the following tasks:
1. Open in Layout view the Inventory Status Report that you created in Chapter 1. Add a total for the Inventory Value field. Be sure the total is completely displayed. Display the average cost. If there are fewer than 10 items on hand, the value should appear in a red bold font. Filter the report for all items
where the number on hand is 5 or less. Save the filtered report as Filtered Inventory Status Report.2. Create the Items by Vendor report shown in Figure 4 – 84.
3. Create the form shown in Figure 4 – 85. If there are fewer than 10 items on hand, the value should appear in a red bold font. Save the form as Item Update Form.
4. Filter the Item Update Form for all items where the cost is less than $3.00 and sort the results in descending order by cost. Save the form as Filtered Item Update Form.
5. Submit the revised database in the format specified by your instructor.
Learn More -
Microsoft Access 2010 Chapter 7 Lab 2 Querying the Walburg Energy Alternatives Database Using SQL
$30.00Microsoft Access 2010 Chapter 7 Lab 2 Querying the Walburg Energy Alternatives Database Using SQL
Problem: The manager of the Walburg Energy Alternatives store would like to learn more about SQL and has determined a number of questions he wants SQL to answer. You must obtain answers to the questions posed by the manager.
Instructions: If you are using the Microsoft Access 2010 Complete or the Microsoft Access 2010 Comprehensive text, open the Walburg Energy Alternatives database that you used in Chapter 6. Otherwise, see your instructor for information on accessing the files required in this book.Perform the following tasks:
Learn More
1. Find all records in the Item table where the difference between the cost of the item and the selling price of the item is less than $0.25 (25 cents). Display the item number, description, cost, and selling price in the query result. Save the query as Lab 7-2 Step 1 Query.
2. Display the item number, description, and profit (selling price – cost) for all items. Name the computed field Profit. Save the query as Lab 7-2 Step 2 Query.
3. Find all items where the description begins with the letter, W. Include the item number and description in the result. Save the query as Lab 7-2 Step 3 Query.
4. Display the vendor name, item number, description, and cost for all items where the number on hand is less than 10. Sort the results in ascending order by vendor name and description. Save the query as Lab 7-2 Step 4 Query.
5. Find the average cost by vendor. Name the computed field Average Cost. Save the query as Lab 7-2 Step 5 Query.
6. Find the total number of reordered items for each item in the Reorder table. Name the computed field Total Ordered. Include the item number in the result. Save the query as Lab 7-2 Step 6 Query.
7. Add the following record to the Reorder table.
Item Number Date Ordered Number Ordered
8590 4/12/2012 3
Save the steps to add the record as Lab 7-2 Step 7 Query.
8. Update the Number Ordered field to 5 for those records where the Item Number is 8590 and the date ordered is 4/12/2012. Save the steps to update the record as Lab 7-2 Step 8 Query.
9. Delete all records where the Item Number is 8590 and the date ordered is 4/12/2012. Save the steps to delete the record as Lab 7-2 Step 9 Query.
10. Submit the revised database in the format specified by your instructor. -
Microsoft Access 2010 Chapter 4 Lab 1 Presenting Data in the ECO Clothesline Database
$20.00Microsoft Access 2010 Chapter 4 Lab 1 Presenting Data in the ECO Clothesline Database
Problem: The management of ECO Clothesline already has realized the benefits from the database of customers and sales reps that you created. The management now would like to prepare reports and forms for the database.
Instructions: If you are using the Microsoft Access 2010 Complete or the Microsoft Access 2010 Comprehensive text, open the ECO Clothesline database that you used in Chapter 3. Otherwise, see your instructor for information on accessing the files required in this book.
Perform the following tasks:
1. Open in Layout view the Customer Balance Report you created in Chapter 1 and revised in Chapter 3. Modify the report to create the report shown in Figure 4–81. Group the report by Customer Type and sort by Customer Number within Customer Type. Add the Amount Paid field to the report and include totals for the Balance and Amount Paid fields.2. Create the Customers by Sales Rep report shown in Figure 4–82. Include a total for the Balance field. Change the orientation to landscape. Make sure the total control displays completely. (Hint: Use Layout view to make this adjustment.)
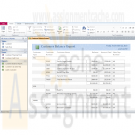
3. Create the Customer Financial Form shown in Figure 4–83. The form includes the date.
4. Create mailing labels for the Customer table. Use Avery labels C2163 and format the labels with customer name on the first line, street on the second line, and city, state, and postal code on the third line. Include a comma and a space after city and a space between state and postal code. Sort the labels by postal code.
5. Submit the revised database in the format specified by your instructor.
Learn More -
Microsoft Access 2010 CHAPTER 4 Apply your Knowledge AC 261 and AC 262
$20.00Microsoft Access 2010 CHAPTER 4 Apply your Knowledge AC 261 and AC 262
Creating a Report and a Form
Instructions: Start Access. If you are using the Microsoft Access 2010 Complete or the Microsoft Access 2010 Comprehensive text, open the Babbage CPA Firm database that you used in Chapter 3. Otherwise, see your instructor for information on accessing the files required in this book.Perform the following tasks:
1. Create the Clients by Bookkeeper report shown in Figure 4–75. The report is grouped by bookkeeper number and sorted by client number within bookkeeper number. Include totals for the Amount Paid and Balance Due fields. Change the orientation to landscape.2. Create the Client Financial Form shown in Figure 4–76 for the Client table. The form includes the current date and is similar in style to that shown in Figure 4–3 on page AC 212.
3. Submit the revised database in the format specified by your instructor.
Learn More -
Microsoft Access 2010 Chapter 2 Lab 1: Querying the ECO Clothesline Database
$20.00Microsoft Access 2010 Chapter 2 Lab 1: Querying the ECO Clothesline Database
Learn More
Problem: The management of ECO Clothesline has determined a number of questions it wants the database management system to answer. You must obtain answers to the questions posed by management.
Instructions: Use the database modified in the In the Lab 1 of Chapter 1 on page AC 66 for this assignment, or see your instructor for information on accessing the files required for this book.
Perform the following tasks:
1. Open the ECO Clothesline database and create a new query for the Customer table that includes the Customer Number, Customer Name, Amount Paid, and Sales Rep Number fields in the design grid for all customers where the sales rep number is 49. Save the query as Lab 2-1 Step 1 Query.
2. Create a query that includes the Customer Number, Customer Name, and Amount Paid fields for all customers located in Virginia (VA) with a paid amount greater than $1,000.00. Save the query as Lab 2-1 Step 2 Query.
3. Create a query that includes the Customer Number, Customer Name, Street, and City fields for all customers whose names begin with T. Save the query as Lab 2-1 Step 3 Query.
4. Create a query that lists all cities in ascending order. Each city should appear only once. Save the query as Lab 2-1 Step 4 Query.
5. Create a query that allows the user to enter the city to search when the query is run. The query results should display the Customer Number, Customer Name, Balance, and Amount Paid fields. Test the query by searching for those records where the client is located in Ashton. Save the query
as Lab 2-1 Step 5 Query.
6. Include the Customer Number, Customer Name, and Balance fields in the design grid. Sort the records in descending order by the Balance field. Display only the top 25 percent of the records in the query result. Save the query as Lab 2-1 Step 6 Query.
7. Join the Sales Rep and the Customer table. Include the Sales Rep Number, First Name, and Last Name fields from the Sales Rep table. Include the Customer Number, Customer Name, and Balance from the Customer table. Sort the records in ascending order by sales rep’s last name and customer name. All sales reps should appear in the result even if they currently have no customers. Save the query as Lab 2-1 Step 7 Query.
8. Open the Lab 2-1 Step 7 Query in Design view and remove the Sales Rep table. Add the Amount Paid field to the design grid. Calculate the total of the balance and amount paid amounts. Assign the alias Total Amount to the calculated fi eld. Change the caption for the Balance field to Due. Save the query as Lab 2-1 Step 8 Query.
9. Create a query to display the average balance amount for all customers. Save the query as Lab 2-1 Step 9 Query.
10. Create a query to display the average balance amount for sales rep 51. Save the query as Lab 2-1 Step 10 Query.
11. Create a query to display the average balance amount for each sales rep. Save the query as Lab 2-1 Step 11 Query.
12. Create the crosstab shown in Figure 2 – 92. The crosstab groups the total of customers amount paid amounts by state and sales rep number. Save the crosstab as State-Sales Rep Crosstab.
13. Submit the revised database in the format specified by your instructor. -
Microsoft Access 2010 Chapter 6 Lab 1 Adding Tables and Creating Reports for the ECO Clothesline Database
$25.00Microsoft Access 2010 Chapter 6 Lab 1 Adding Tables and Creating Reports for the ECO Clothesline Database
Problem: ECO Clothesline needs to maintain data on a weekly basis on the open orders for its customers. These are orders that have not yet been delivered. To track this information requires a new table, an Open Orders table. The company also needs a report that displays sales rep information as well as information about customers and any open orders that the customer has. The company would like to show its appreciation to current customers by discounting the amount customers currently owe.
Instructions: If you are using the Microsoft Access 2010 Complete or the Microsoft Access 2010 Comprehensive text, open the ECO Clothesline database that you used in Chapter 5. Otherwise, see the inside back cover of this book for instructions on downloading the Data Files for Students, or contact your instructor for more information about accessing the required files.
Perform the following tasks:
1. Create the Open Orders table using the structure shown in Table 6 – 5.2. Import the Open Orders.txt file into the Open Orders table.
3. Create a one-to-many relationship between the Customer table and the Open Orders table.
4. Create a query that joins the Sales Rep and the Customer tables. Include the Sales Rep Number, Last Name, and First Name fields from the Sales Rep table. Include all fields except the Sales Rep Number field from the Customer table. Save the query as Sales Reps and Customers. 5. Create the report shown in Figure 6 – 86. The report uses the Sales Reps and Customers query as the basis for the main report and the Open Orders table as the basis for the subreport. Use the name Sales Rep Master List for the report. The report title has a Text Align property value of Distribute. The Border Width property is hairline and the subreport label is Open Orders. The report is similar in style to the Business Analyst Master List shown in Figure 6 – 1a on page AC 339.
6. Create the Customer Discount Report shown in Figure 6 – 87. The report uses the Sales Reps and Customers query. Customers who have paid $500 or more will receive a 3% discount on the remaining balance, and customers who have paid less than $500 will receive a 1% discount on the remaining balance. The report includes subtotals and grand totals for the Balance and Amount Paid fields. The report is similar in style to the Discount Report shown in Figure 6 – 1b on page AC 340.
7. Submit the revised database in the format specified by your instructor.
Learn More -
Microsoft Access 2010 Chapter 6 Advanced Report Techniques Camashaly Design database AC 338 - AC 416
$25.00Microsoft Access 2010 Chapter 6 Advanced Report Techniques Camashaly Design database AC 338 - AC 416
Read and work through project 6 pp. AC 338- AC 416.
Business Analyst Master List Report, p. AC 380
Discount Report, p. AC 401Project — Multitable FormsProject — Advanced Report Techniques
The owners of Camashaly Design want a master list of business analysts. This list should be available as an Access report. For each business analyst, the report is to include full details for all the clients assigned to the business analyst. In addition, Camashaly offers a range of educational courses designed to help clients understand the various marketing tools available to them. For clients who are taking courses, the report should list the specific courses being offered to the client. The actual report is shown in Figure 6 – 1a. The report is organized by business analyst, with the data for each analyst beginning on a new page. For each business analyst, the report lists the number, fi rst name, and last name. Following the business analyst number and name, the report lists data for each client served by that business analyst. The client data includes the number, name, street, city, state, postal code, client type, services needed, amount paid, current due, and total amount. For each course the client is taking, the report lists the course number, description, total hours the course requires, hours already spent, and hours remaining.Many organizations offer discounts as a way of rewarding current clients and attracting new clients. The owners of Camashaly are considering offering a discount on
the current due amount to its current clients. The exact amount of the discount depends on how much the client already has paid. If the amount paid is more than $4,000, the discount will be 4% of the current due amount. If the amount paid is $4,000 or less, then the discount will be 2% of the current due amount. To assist in determining the discount, Camashaly needs a report like the one shown in Figure 6 – 1b on page AC 340. The report groups clients by business analyst. It includes subtotals of both the Amount Paid and Current Due fields. Also, although not visible in the fi gure, it includes grand totals of both fields at the end of the report. Finally, it shows the discount amount, which is calculated by multiplying the current due amount by .04 (4%) for those clients for whom the amount paid is more than $4,000 and by .02 (2%) for all others.Overview
Learn More
As you read through this chapter, you will learn how to create the reports by
performing these general tasks:
• Create and relate additional tables.
• Create queries for a report.
• Create a report, specify grouping and sorting, and add fields and text boxes to the report.
• Add a subreport to the report.
• Add a title, page number, and date to the report.
• Print and publish a report.
• Create a second report, specify grouping and sorting, and add fields and text boxes to the report.
• Add totals and subtotals to the report, and add a text box that uses a function.

You have no items in your shopping cart.

