MS Access
Need Help in MS Access Assignment?
We can help you if you are having difficulty with your MS Access Assignment. Just email your MS Access Assignment at admin@assignmentcache.com.
We provide help for students all over the world in MS Access Assignment
-

Microsoft Access 2010 Chapter 9 Lab 1 Creating Macros a Navigation Form and a PivotTable for the ECO Clothesline Database
$25.00Microsoft Access 2010 Chapter 9 Lab 1 Creating Macros a Navigation Form and a PivotTable for the ECO Clothesline Database
Lab 1: Creating Macros, a Navigation Form, and a PivotTable for the ECO Clothesline Database
Problem: ECO Clothesline would like an easy way to access the various tables, forms, and reports included in the database. This would make the database much easier to maintain and update.Instructions: If you are using Microsoft Access 2010 Comprehensive text, open the ECO Clothesline database that you used in Chapter 8. Otherwise, contact your instructor for more information about accessing the required files.
Perform the following tasks:
1. Create a macro named Forms and Reports that will include submacros to perform the following tasks:
a. Open the Sales Rep Order Data form in read-only mode.
b. Open the Sales Rep Master Form.
c. Open Customer Master Form.
d. Preview the Sales Rep Master List.
e. Preview the Customer Balance Report.
f. Preview the Customer Discount Report.
g. Export the Sales Rep Master List in the PDF format.
h. Export the Customer Balance Report in the PDF format.
i. Export the Customer Discount Report in the PDF format.2. Create the menu form shown in Figure 9-80. The command buttons should use the macros you created in Step 1 to open the Customer Master Form, the Sales Rep Master Form, and the Sales Rep Order Data form.
3. Create the menu form shown in Figure 9-81. The option group should use the macros you created in Step 1 to preview and export the three reports.
4. Create a datasheet form for the Customer table and name the form Customer. Create a UI macro for the Customer form. When a user clicks a customer number on a row in the datasheet, the Customer Master Form should appear in a pop-up form.
5. Create a datasheet form for the Sales Rep table and name the form Sales Rep. Create a UI macro for the Sales Rep form. When a user clicks a sales rep number on a row in the datasheet, the Sales Rep Master Form should appear in a pop-up form.
6. Create the navigation form shown in Figure 9-82 for the ECO Clothesline database. Use the same design for your navigation form as the one illustrated in this chapter. For example, the Customer tab should display the Customer form you created in Step 4, and the Sales Rep tab should display the Sales Rep form you create in Step 5. The Forms tab should display the Form List form you created in Step 3, and the Reports tab should display the Reports List form you created in Step 3.
7. Submit the revised database in the format specified by your instructor.
Learn More -
Microsoft Access 2010 Chapter 8 Lab 1 Applying Advanced Form Techniques to the ECO Clothesline Database
$25.00Microsoft Access 2010 Chapter 8 Lab 1 Applying Advanced Form Techniques to the ECO Clothesline Database
Lab 1: Applying Advanced Form Techniques to the ECO Clothesline Database
Problem: ECO Clothesline needs a form for the Customer table that will allow users to update data in the table ECO also needs a form to display open orders data for sales reps.Instructions: If you are using Microsoft Access 2010 Comprehensive text, open the ECO Clothesline database that you used in Chapter 7. Otherwise, see your instructor for information on accessing the files required in this book.
Perform the following tasks:
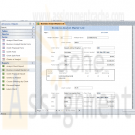
1. Create a query that includes the Sale Rep Number field from the Sales Rep tan;e, the Customer Number field from the Customer table and the Order Number and Amount fields from the Open Orders table. Sort the query in ascending order by Sales Rep Number, Customer Number, and Order NUmber Save the query as Sales Rep and Orders.2. Create the form shown in Figure 8-95. total Amount is a calculated control and is the sum of the Balance and Amount Paid amounts. Format the Total Amount control as Currency with two decimal places. (Hint: Use the property sheet for the control.) the form includes command buttons, a combo box for the Sales Rep Number field, and a combo box to search for customers by name. Be sure to sort the customer by names in ascending order, place a rectangle around the combo box, and update the combo box. The user should not be able to tab to the combo box. When the Add Record button is clicked, the insertion point should be in the customerNumber field. The form is similar in style to the form shown in Figure 8-1 on page AC 466.
3. Create the Sales Rep Order Data form shown in Figure 8-96. The subform that appears in the Datasheet tab uses the Sales Reps and Orders query (Figure 8-96a). The chart ghat appears in the Chart tab uses the same query (Figure 8-96b).
4. Submit the revised database in the format specified by your instructor.
Learn More -

Microsoft Access 2010 Chapter 8 Advanced Form Techniques Camashaly Design database AC 466 - AC 520
$25.00Microsoft Access 2010 Chapter 8 Advanced Form Techniques Camashaly Design database AC 466 - AC 520
Save the Client View and Update Form. AC 499 - AC 500.
Save the Multipage Form. AC 500 - AC 518Project - Advanced Form Techniques
Camashaly Design wants two additional form to use with its Clients and Business Analyst tables. The first form Client View and Update Form (Figure 8-1a), contains the fields in the Client table. The form has five command buttons: Next Record, Previous Record, Add Record, Delete Record, and Close Form. Clicking nay of these buttons causes the action indicated on the button to take place.
The form also contains a combo box for the Business Analyst Number field that assists users in selecting the correct analyst (Figure 8-1b).
To assist users in finding a client when they know the clients name, the form also includes a combo box they can use for this purpose (Figure 8-1c). After clicking the arrow, the user can simply click the client they want to find; Access then will locate the client and display that clients data in the form (Figure 8-1d).For the second new form, Camashaly Design needs a multipage form that lists the numbers and names of the analyst. Selecting the first tab, the one labelled Datasheet, displays a subform listing about the course offering for clients of the selected analyst (Figure 8-2a).
Learn More
Selecting the other tab, the one labelled Charts, displays two charts that illustrate the total hours spent and hours remaining by the analyst for the various courses (Figure 8-2b). In both charts, the slices of the pie represent the various course. They are color coded and legend at the bottom indicates the meaning of various colors. The size of pie slice gives a visual representation of the portion of the hours spent or hours remaining by the analyst for the particular course. The chats also includes specific percentages. If you look at the bottom purple slice in the Hours Spent by Course Offering chart, for example, you see that the color represent course C04. It signifies 42% of the total. Thus, for all the hours already spent on the various course offering by analyst 11, 42% have been spent on course C04. -

Microsoft Access 2010 Chapter 7 Using SQL Camashaly Design database AC 418 - AC 457
$25.00Microsoft Access 2010 Chapter 7 Using SQL Camashaly Design database AC 418 - AC 457
Read and work through project 7 pp. AC 418- AC 457.
The owners of Camashaly Design want to be able to use the extended data management capabilities available through SQL. In becoming familiar with SQL, Camashaly would like to create a wide variety of SQL queries.
Similar to creating queries in Design view, SQL provides a way of querying relational databases. In SQL, however, instead of making entries in the design grid, you type commands into SQL view to obtain the desired results, as shown in Figure 7 – 1a. You then can click the View button to view the results just as when you are creating queries in Design view. The results for the query in Figure 7 – 1a are shown in Figure 7 – 1b.Overview
As you read through this chapter, you will learn how to create SQL queries by performing these general tasks:
• Create queries involving criteria.
• Sort the results of a query.
• Group records in a query and perform group calculations.
• Join tables in queries.
• Create a query that involves a subquery.
• Update data using the INSERT, UPDATE, and DELETE commands.SQL Query Guidelines.
When querying a database using SQL, you must design queries appropriately, identifying the required fields, tables, criteria, sorting, grouping, and operations to use. Querying in SQL also requires proper expression of queries using SQL clauses and formatting.
1. Select the fields for the query. Examine the requirements for the query you are constructing to determine which fields are to be included.
2. Determine which table or tables contain these fields. For each field, determine the table in which it is located.
3. Determine criteria. Determine any criteria that data must satisfy to be included in the results. If there are more than two tables in the query, determine the criteria to be used to ensure the data matches correctly.
4. Determine sort order. Is the data to be sorted in some way? If so, by what field or fields is it to be sorted?
5. Determine grouping. Is the data to be grouped in some way? If so, by what field is it to be grouped? Identify any calculations to be made for the group.
6. Determine any update operations to be performed. Determine whether rows need to be inserted, changed, or deleted. Determine the tables involved.
When necessary, more specific details concerning the above decisions and/or actions are presented at appropriate points in the chapter. The chapter also will identify the use of these guidelines in creating SQL queries such as the one shown in Figure 7 – 1.To Start Access
Learn More
The following steps, which assume Windows 7 is running, start Access based on a typical installation. You may need to ask your instructor how to start Access for your computer.
Click the Start button on the Windows 7 taskbar to display the Start menu.
Type Microsoft Access as the search text in the ‘Search programs and files text box and watch the search results appear on the Start menu. -
Microsoft Access 2010 Chapter 6 Advanced Report Techniques Camashaly Design database AC 338 - AC 416
$25.00Microsoft Access 2010 Chapter 6 Advanced Report Techniques Camashaly Design database AC 338 - AC 416
Read and work through project 6 pp. AC 338- AC 416.
Business Analyst Master List Report, p. AC 380
Discount Report, p. AC 401Project — Multitable FormsProject — Advanced Report Techniques
The owners of Camashaly Design want a master list of business analysts. This list should be available as an Access report. For each business analyst, the report is to include full details for all the clients assigned to the business analyst. In addition, Camashaly offers a range of educational courses designed to help clients understand the various marketing tools available to them. For clients who are taking courses, the report should list the specific courses being offered to the client. The actual report is shown in Figure 6 – 1a. The report is organized by business analyst, with the data for each analyst beginning on a new page. For each business analyst, the report lists the number, fi rst name, and last name. Following the business analyst number and name, the report lists data for each client served by that business analyst. The client data includes the number, name, street, city, state, postal code, client type, services needed, amount paid, current due, and total amount. For each course the client is taking, the report lists the course number, description, total hours the course requires, hours already spent, and hours remaining.Many organizations offer discounts as a way of rewarding current clients and attracting new clients. The owners of Camashaly are considering offering a discount on
the current due amount to its current clients. The exact amount of the discount depends on how much the client already has paid. If the amount paid is more than $4,000, the discount will be 4% of the current due amount. If the amount paid is $4,000 or less, then the discount will be 2% of the current due amount. To assist in determining the discount, Camashaly needs a report like the one shown in Figure 6 – 1b on page AC 340. The report groups clients by business analyst. It includes subtotals of both the Amount Paid and Current Due fields. Also, although not visible in the fi gure, it includes grand totals of both fields at the end of the report. Finally, it shows the discount amount, which is calculated by multiplying the current due amount by .04 (4%) for those clients for whom the amount paid is more than $4,000 and by .02 (2%) for all others.Overview
Learn More
As you read through this chapter, you will learn how to create the reports by
performing these general tasks:
• Create and relate additional tables.
• Create queries for a report.
• Create a report, specify grouping and sorting, and add fields and text boxes to the report.
• Add a subreport to the report.
• Add a title, page number, and date to the report.
• Print and publish a report.
• Create a second report, specify grouping and sorting, and add fields and text boxes to the report.
• Add totals and subtotals to the report, and add a text box that uses a function. -
Microsoft Access 2010 Chapter 6 Lab 1 Adding Tables and Creating Reports for the ECO Clothesline Database
$25.00Microsoft Access 2010 Chapter 6 Lab 1 Adding Tables and Creating Reports for the ECO Clothesline Database
Problem: ECO Clothesline needs to maintain data on a weekly basis on the open orders for its customers. These are orders that have not yet been delivered. To track this information requires a new table, an Open Orders table. The company also needs a report that displays sales rep information as well as information about customers and any open orders that the customer has. The company would like to show its appreciation to current customers by discounting the amount customers currently owe.
Instructions: If you are using the Microsoft Access 2010 Complete or the Microsoft Access 2010 Comprehensive text, open the ECO Clothesline database that you used in Chapter 5. Otherwise, see the inside back cover of this book for instructions on downloading the Data Files for Students, or contact your instructor for more information about accessing the required files.
Perform the following tasks:
1. Create the Open Orders table using the structure shown in Table 6 – 5.2. Import the Open Orders.txt file into the Open Orders table.
3. Create a one-to-many relationship between the Customer table and the Open Orders table.
4. Create a query that joins the Sales Rep and the Customer tables. Include the Sales Rep Number, Last Name, and First Name fields from the Sales Rep table. Include all fields except the Sales Rep Number field from the Customer table. Save the query as Sales Reps and Customers. 5. Create the report shown in Figure 6 – 86. The report uses the Sales Reps and Customers query as the basis for the main report and the Open Orders table as the basis for the subreport. Use the name Sales Rep Master List for the report. The report title has a Text Align property value of Distribute. The Border Width property is hairline and the subreport label is Open Orders. The report is similar in style to the Business Analyst Master List shown in Figure 6 – 1a on page AC 339.
6. Create the Customer Discount Report shown in Figure 6 – 87. The report uses the Sales Reps and Customers query. Customers who have paid $500 or more will receive a 3% discount on the remaining balance, and customers who have paid less than $500 will receive a 1% discount on the remaining balance. The report includes subtotals and grand totals for the Balance and Amount Paid fields. The report is similar in style to the Discount Report shown in Figure 6 – 1b on page AC 340.
7. Submit the revised database in the format specified by your instructor.
Learn More -

Microsoft Access 2010 Chapter 3 Lab 2 Maintaining the Walburg Energy Alternatives Database
$20.00Microsoft Access 2010 Chapter 3 Lab 2 Maintaining the Walburg Energy Alternatives Database
Problem: The management of the Walburg Energy Alternatives recently acquired some items from a store that is going out of business. You now need to append these new items to the current item table. You also need to change the database structure and add some validation rules to the database.
Use the database modified in the In the Lab 2 of Chapter 2 on page AC 134 for this assignment. You also will use the More Items database from the Data Files for Students. See the inside back cover of this book for instructions for downloading the Data Files for Students, or see your instructor for information on accessing the required files.Perform the following tasks:
Learn More
1. Open the More Items database from the Data Files for Students.
2. Create a new query for the Item table and add all fields to the query.
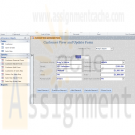
3. Using an append query, append all records in the More Items database to the Item table in the Walburg Energy Alternatives database, as shown in Figure 3 – 87.
4. Save the append query as Walburg Append Query and close the More Items database.
5. Open the Walburg Energy Alternatives database and then open the Item table in Datasheet view. There should be 20 records in the table.
6. The items added from the More Items database do not have a vendor assigned to them. Assign items 1234 and 2234 to vendor JM. Assign item 2216 to vendor AS. Assign items 2310 and 2789 to vendor SD.
7. Create an advanced filter for the Item table. The filter should display records with fewer than 10 items on hand and be sorted in ascending order by Description. Save the filter settings as a query and name the filter Reorder Filter.
8. Make the following changes to the Item table:
a. Change the field size for the On Hand field to Integer. The Format should be fixed and the decimal places should be 0.
b. Make Description a required field.
c. Specify that the number on hand must be between 0 and 50. Include validation text.
d. Add a calculated field Inventory Value (On Hand*Cost) following the Cost field. Format the field as currency.
9. Save the changes to the table design. If a dialog box appears indicating that some data may be lost, click the Yes button.
10. Add the Inventory Value field to the Inventory Status Report. Place the field after the Cost field. Save the changes to the report.
11. Specify referential integrity between the Vendor table (the one table) and the Item table (the many table). Cascade the update but not the delete.
12. Submit the revised More Items database and the Walburg Energy Alternatives database in the format specified by your instructor. -

Microsoft Access 2010 CHAPTER 5 Multitable Forms Camashaly Design AC 274 - AC 326
$20.00Microsoft Access 2010 CHAPTER 5 Multitable Forms Camashaly Design AC 274 - AC 326
Learn More
Project — Multitable Forms
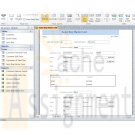
Camashaly Design uses its database to keep records about clients and business analysts. After using the database for several months, however, Camashaly has found that it needs to maintain additional data on its business analysts. The company wants to identify those business analysts who have a professional certifi cate in business analysis, store the start date of each business analyst in the database, and include notes about each business analyst as well as the business analyst’s picture. Additionally, business analysts now maintain files about potential contacts. These files are separate from the database; some are maintained in Word and others in Excel. Camashaly would like a way to attach these files to the corresponding business analyst’s record in the database. Finally, Camashaly wants to add the Phone Number field to the Business Analyst Table. Users should type only the digits in the telephone number and then have Access format the number appropriately. If the user enters 7195558364, for example, Access will format the number as (719) 555-8364.
After the proposed fields have been added to the database, Camashaly wants users to be able to use a form that incorporates the Client and Business Analyst tables and that includes the newly added fields as well as some of the existing fields. The form also should include the client number, name, amount paid, and current due amount for the clients of each business analyst. Camashaly would like to see multiple clients on the screen at the same time (Figure 5 – 1). The database should allow users to scroll through all the clients of a business analyst and to open any of the attachments concerning the business analyst’s Client Notes. Finally, Camashaly requires queries that use the Certification, Start Date, and Comment fields. -

Microsoft Access 2010 CHAPTER 4 Creating Reports and Forms Camashaly Design AC 209 - AC 265
$20.00Microsoft Access 2010 CHAPTER 4 Creating Reports and Forms AC 209 - AC 265
Learn More
Project — Reports and Forms
Camashaly Design has realized several benefits from using the database of clients and analysts. Camashaly hopes to realize additional benefits using two custom reports that meet their specific needs. Figure 4 – 1 shows the first report, which is a modified version of an existing report. The report features grouping. The report shown in Figure 4 – 1 groups records by client types. There are three separate groups, one each for the three possible client types: NON, RET, and SER. The appropriate type appears before each group. The totals of the Amount Paid, Current Due, Total Amount, and Hrs YTD fields for the clients in the group (called a subtotal) appear after the group. At the end of the report are grand totals of the same fields.
Figure 4 – 2 shows the first page of the second report. This report encompasses data from both the Business Analyst Table and the Client table. Like the report in Figure 4 – 1, the data is grouped, although this time it is grouped by analyst number. Not only does the analyst number appear before each group, but the first name and last name of the analyst appear as well. Like the first report, this report contains subtotals.
Camashaly also wants to improve the data entry process by using a custom form, as shown in Figure 4 – 3. The form has a title and a date. It does not contain all the fields in the Client table, and the fields are in a different order than in the table. For this form,
Camashaly likes the appearance of including the fields in a grid. -

Access 2010 Capstone Project the Wee Ones Database
$20.00Access Capstone Project
Creating, Querying, and Maintaining the Wee Ones Database Problem:Elizabeth Jordan has asked you to work on a special project for the Wee Ones Day Care. She has been keeping information about the children in the program and their parents in Word documents and Excel workbooks, and she would like you to create an Access database for storing this information, using the data shown in Figure 1 – 7.
Elizabeth keeps a list of the children and their enrollment details in a Word document. She maintains their tuition and fee information in an Excel workbook.
She also maintains information on the children’s parents. She keeps their parents’ addresses in a Word document. However, she keeps the previous and current balances for each parent in an Excel workbook, which she provides to you electronically. The parents’ financial information includes the parent ID, their last and first names, previous balance, and current balance.
Elizabeth also keeps a list of which children belong to which parent. Each child has one parent listed as the ‘parent of record,’ but a parent or guardian may be responsible for more than one child. The following parents have one child in the program: Cho Song, Karen Leon, Mara Olivo, Mary Ann Arnold, Daniel Navarro, Addas Abdi, and Claire Montout. Allen Kwan has two children in the program. The Hunter twins’ mother’s name is Jennifer White. Barbara Lehmann is responsible for Emma Chao, Lucas Jordan, and Paul Lehmann. Susan Hargraves has reserved a place at Wee Ones for her child, but her child has not yet enrolled.
Instructions Part 1: Using the data shown in Figure 1 – 7, design and create the Wee Ones database. Use the database design guidelines provided in Chapter 1 to help you in the design process.
Instructions Part 2: Answer the following questions, using the Parent table, and include the Parent ID, parent’s first and last names, City, Previous Balance, and Current Balance fields. Save each query.Instructions Part 3: Elizabeth needs to update some parent and child information. Create a split form for the Parent table. Filter the form to locate Parent ID P-131 and change their address to 1010 Florissant Rd, Lincolnville, 02923. Save the form as Parent Split Form.
Learn More

You have no items in your shopping cart.

