Search results for 'accounting'
6 Item(s)
Grid List
-
BMIS 208 Programming Assignment 5 Depreciation using Sum of the Years Digits Method
$15.00BMIS 208 Programming Assignment 5 Depreciation using Sum of the Years Digits Method
Instructions:
Depreciation is the systematic and rational allocation of cost over a period of time.The study of accounting teaches us that several different methods are used to allocate the cost of an asset over time. Some methods are based upon the amount of time that an asset is expected to be useful (e.g. straight line, double-declining balance, sum-of-the-years digits methods), while others are based upon the amount of activity an asset incurs over its useful life (i.e. units of production method). In this assignment, you will write a Visual Basic program that calculates depreciation of an asset using the sum-of-the-years digits method. Your program should perform the following tasks:
Deliverables:
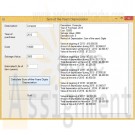
a. Request a description of the item, the year of the purchase, the cost of the item, the salvage value of the item, and the number of years to be depreciated (estimated life) using textboxes.
b. A single button should appear on the form that, when clicked, calculates the results of the depreciation and displays the results in a listbox as shown below.
c. Using the formula below, calculate the amount of depreciation per year given the values entered by the user. You may assume a January 1 date of purchase for the year entered. Display a year-by-year description of the depreciation. See the diagram below.Sum-of-the-years digits formula:
Step 1: Calculate the sum of the year's digits: Add up the number of years that the asset will be in use. (i.e. if an asset has a useful life of 5 years, add the numbers 5+4+3+2+1 = 15.) This is your denominator in the formula.Step 2: Express each year as a ratio of the year number divided by the result calculated in Step 1. (Round to the nearest whole number.)
Example:
Asset cost: 10,000
Salvage value: 2,000
Useful life: 5 years
Denominator: 15
Year 1 multiplier: 5/15
Year 2 multiplier: 4/15
Year 3 multiplier: 3/15
Year 4 multiplier: 2/15
Year 5 multiplier: 1/15Step 3: Multiply the cost of the asset (less its salvage value) by each year's multiplier to compute each year's depreciation.
Example:
Depreciation Carrying amount of asset Total depreciation to-date
At End of Year (Accumulated Depreciation)
(Book Value)
Year 1: 5/15 * (10,000 - 2,000) = $2,667 10,000 - 2,667 = 7,333 2,667
Year 2: 4/15 * (10,000 - 2,000) = $2,133 7,333 - 2,133 = 5,200 2,667 + 2,133 = 4,800
Year 3: 3/15 * (10,000 - 2,000) = $1,600 5,200 - 1,600 = 3,600 4,800 + 1,600 = 6,400
Year 4: 2/15 * (10,000 - 2,000) = $1, 067 3,600 - 1,067 = 2,533 6,400 + 1,067 = 7,467
Year 5: 1/15 * (10,000 - 2,000) = $ 533 2,533 - 533 = 2,000 7,467 + 533 = 8,000
(2,000 is the salvage value.
So, this is correct.)Adding all of the years of depreciation yields $8,000 (2,667 + ,133 + 1,600 + 1,067 + 533), which is equal to the cost - salvage value of the asset.
[Note that you cannot depreciate an asset below its salvage value.]
d. Note that in your output, you must indicate the remaining balance of the item at the beginning of the year, followed by the amount of depreciation to be taken during the year, followed by the total amount of accumulated depreciation on the asset since its purchase, and finally followed by the net book value (original value of the asset being depreciated less the total depreciation taken to-date) at the end of the year.e. Make sure you use good software design principles, such as clearing the listbox after a user clicks a button but before new results are displayed. Make sure you also check for valid inputs (i.e. no textboxes left blank, no negative numbers, no alphabetic characters where numbers are expected, etc.)
Learn More -
PRG 421 Week 2 GUI Components Program
$20.00PRG 421 Week 2 GUI Components Program
Learn More
For this assignment, you will choose from the following options:
Option 1: Retail Calculator
A retailer would like a calculator to indicate sale prices when he marks items down at various percentages.
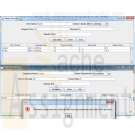
Design, implement, test, and debug a GUI application that allows the retailer to enter the item’s name, the item’s original price, and the percentage discounted.
• The application should include a Calculate button that, when pressed, computes and displays the sale price in a label or text field.
• The program should allow the retailer to enter any number of items in this manner.
• Include an Exit button to end the execution of the application.
• The program should allow the user to select a department from a menu. You may create the menu as a true menu, a JComboBox, or radio buttons.
• Create your own list to populate the menu: men’s clothing, women’s clothing, house wares, and so forth.
• Include at least five departments.
• Create a JTextArea or a JTable to display each of the following for each item entered:
o Item name
o Department
o Original price
o Sale price
Option 2: Payroll Application
An employer is looking for an easier way to track employee pay.
Design, implement, test, and debug an application to compute an employee’s weekly pay. If the employee works more than 40 hours a week, the employee earns 1.5 times the basic hourly pay for any time worked over 40 hours. The program should allow the user to input the employee’s name, the number of hours worked, and the hourly rate.
• The application should include a Calculate button that, when pressed, computes and displays the total pay in a label or text field.
• The program should allow the user to enter information for any number of employees in this manner.
• Include an Exit button to end the execution of the application.
• The program should allow the user to select the employee’s department from a menu. This can be a standard menu, radio buttons, or a JComboBox.
• Create your own list to populate the menu: Marketing, IT, Accounting, and so forth.
• Include at least five departments.
• Validate the employee’s hourly wage and hours worked according to the following rules:
The hourly wage must be at least $6 per hour and cannot be more than $150 per hour. It must be numeric.
The hours worked must be a numeric value greater than or equal to 0 and cannot be greater than 60.
• Create a JTextArea, JTable, or other form of a table to your application and use that to list the following for every employee:
o Name
o Department
o Weekly salary
Add each employee to the list after you have computed that employee’s salary. -

POS 410 Week 2 Table Queries SQL for Business
$12.00POS 410 Week 2 Table Queries SQL for Business
Learn More
Create two tables using the specifications listed.
• Use the database built in last week’s assignment to create the two tables and associated columns listed below. Table names, data types, and column lengths must be used as specified; column names may be created as desired and appropriate. Avoiding the use of spaces and special characters in the column names is recommended.
• In the Employee table, create an Employee ID column that generates a unique number for each employee and designate the column as the Primary Key. In the Job table, use the job title column as the table’s primary key.
Table Name = Employee_Tbl
• Employee ID (type= numeric identity) PK
• Last name (type=varchar(30))
• First name (type=varchar(30))
• Address (type=varchar(30))
• City (type=varchar(30))
• State (type=varchar(2))
• Telephone area code (type=varchar(3))
• Telephone number (type=varchar(7))
• Employer Information Report (EEO-1) classification (type=varchar(30))
• Hire date (type=date)
• Salary (type=money)
• Gender (type=varchar(1))
• Age (type=numeric)
• Job Title (type=varchar(30))
Table Name = Job_Tbl
• Job title (type=varchar(30)) PK
• Job description (type=varchar(2000))
• Exemption status (type=varchar(1))
Use the SQL INSERT statement to go to the human resources department in the Kudler Fine Foods Virtual Organization. Using information found in the employee files for the La Jolla and Encinitas stores, enter records into the Employee table for the following employees:
• Glenn Edelman
• Eric McMullen
• Raj Slentz
• Erin Broun
• Donald Carpenter
• David Esquivez
• Nancy Sharp
Use the information from the job classifications and descriptions to enter records into the Job Title table for the following titles:
• Accounting clerk
• Assistant manager
• Bagger
• Cashier
• Computer support specialist
• Director of finance and accounting
• Retail assistant bakery and pastry
• Retail assistant butchers and seafood specialists
• Stocker
Hint: Data entered into the job title column of the employee_tbl and job_tbl tables must match exactly, including case, spaces, and so on. If they do not match exactly, you will not be able to create the foreign key or perform the joins that are required in later assignments.
Deliverables: check your results by selecting all of the data from both tables (one table at a time). Copy and paste screen images of your work in a word doc, then post as an attachment in your assignment tab of the classroom. You may need to resize your windows and take multiple screen shots to capture all of the required information. The screen images should show the following information:
• Database, table, and column definitions
• SQL statements used to load the data
• Data stored in both tables (display contents after data is loaded)
Refer to the materials forum for the rubric that will be used to grade this assignment. -

COM 330 Chapter 6 Assignment
$20.00COM 330 Chapter 6 Assignment
Learn More
1. Using the STUDENT table structure shown in Table P6.4, do the following.
Table P6.4 Sample STUDENT Records
Attribute Name Sample Value Sample Value Sample Value Sample Value Sample Value
STU_NUM 211343 200128 199876 199876 223456
STU_LNAME Stephanos Smith Jones Ortiz McKulski
STU_MAJOR Accounting Accounting Marketing Marketing Statistics
DEPT_CODE ACCT ACCT MKTG MKTG MATH
DEPT_NAME Accounting Accounting Marketing Marketing Mathematics
DEPT_PHONE 4356 4356 4378 4378 3420
COLLEGE_NAME Business Admin Business Admin Business Admin Business Admin Arts & Sciences
ADVISOR_LNAME Grastrand Grastrand Gentry Tillery Chen
ADVISOR_OFFICE T201 T201 T228 T356 J331
ADVISOR_BLDG Torre Building Torre Building Torre Building Torre Building Jones Building
ADVISOR_PHONE 2115 2115 2123 2159 3209
STU_GPA 3.87 2.78 2.31 3.45 3.58
STU_HOURS 75 45 117 113 87
STU_CLASS Junior Sophomore Senior Senior Junior
c. Write the relational schema and draw the dependency diagram to meet the 3NF requirements to the greatest extent possible. If you believe that practical considerations dictate using a 2NF structure, explain why your decision to retain 2NF is appropriate. If necessary, add or modify attributes to create appropriate determinants and to adhere to the naming conventions.
d. Draw the Crow’s Foot ERD.
Load the data from table P6.4 into an Access database. Add 5 additional students (make up your data) following the table structure.
Create a query in Access that list the students who have a Statistics major.
List the students who have a GPA of 3.45 or higher in a report.
Report the students who have the same advisor.
Submit c and d as an attachment, attach your Access database. -

CS362 Structured Query Language for Data Management Week 2 IP
$20.00CS362 Structured Query Language for Data Management Week 2 IP
Learn More
After creating the database schema, use Insert, Update, and Delete commands to populate the tables with the following information.
1. Insert the following classes' records:
Code Name Description
ACCT306 Accounting 1 This course introduces accounting concepts and explores the accounting environment. It covers the basic structure of accounting, how to maintain accounts, use account balances to prepare financial statements, and complete the accounting cycle. It also introduces the concept of internal control and how to account for assets.
CS362 Structured Query Language for Data Management This course gives complete coverage of SQL, with an emphasis on storage, retrieval, and manipulation of data.
ENG115 English Composition In this course, students focus on developing writing skills through practice and revision. Students will examine expository, critical, and persuasive essay techniques.
FIN322 Investments This course focuses on investments and investment strategies. Various investment vehicles such as stocks, bonds, and commodities are examined. Students will explore the principles of security analysis and valuation.
2. Insert the following advisors' records:
Name Email
Fred Stone fred@college.edu
Bob Gordon bob@college.edu
Jack Simpson jack@college.edu
3. Insert the following students' records:
Name Birthdate Gender StartDate GPA IsActive AdvisorID
Craig Franklin 1970-03-15 Male 2010-05-30 3.10 Yes 3
Harriet Smith 1982-04-15 Female 2010-05-30 3.22 Yes 1
George David 1984-11-05 Male 2010-10-01 0.00 Yes 3
Ben Jefferson 1976-09-25 Male 2009-02-21 1.80 No, the student has gone on temporary leave to pursue other opportunities but plans on returning in 1 year. 3
4. Delete the course named Investments from the system.
5. Change Harriet Smith’s birthdate to April 25, 1982 and her GPA to 3.25.
Copy and paste the work into your Key Assignment document and include screen shots of each step, describe what you did for each step and paste in the actual SQL text used to perform each step. Provide an introduction explaining the important of these commands in relation to your overall Key Assignment. -

DBM 449 Lab 3 Distributed Database
$20.00L A B O V E R V I E W
Scenario/Summary
To the end user working with databases distributed through out a company's network is not different than working with multiple tables within a single database. The fact that the different databases exist in other locations should be totally transparent to the user. For this lab we are going to take on the roll of a database administrator in a company that has three regional offices in the country. You work in the central regional office, but there is also a West Coast Region located in Seattle and an East Coast Region located in Miami. Your roll is to gather report information from the other two regions.For this lab you are going to work with three different databases. You already have your own database instance. You will also be working with the a database named SEATTLE representing the West Coast Region and a database named MIAMI representing the East Coast Region. Login information for these two additional database instances is as follows:
SEATTLE: Userid - seattle_user
Password - seattle
Host String - seattleMIAMI: Userid - miami_user
Password - miami
Host String - miamiTo record your work for this lab use the LAB3_Report.doc found in Doc Sharing. As in your previous labs you will need to copy/paste your SQL statements and results from SQL*Plus into this document. This will be the main document you submit to the Drop Box for Week 3.
L A B S T E P S
STEP 1: Setting up Your Environment- Be sure you are connected to the DBM449_USER schema that was created in lab 1.
- To begin this lab you will need to download the LAB3_DEPTS.SQL script file associated with the link and run the script in your DBM449_USER schema of your database instance. This script contains a single table and that you will be using to help pull data from each of the other two database instances. Notice that the DEPTNO column in this table is the PRIMARY KEY column and can be used to reference or link to the DEPTNO column in the other two database employee tables.
- Now you need to create a couple of private database links that will allow you to connect to your other two regional databases. To accomplish this use the connection information listed above in the Lab Overview section. Name your links using your database instance name together with the region name as the name for the link. Separate the two with an underscore (example - DB1000_SEATTLE).
- After creating both of your database links, query the USER_DB_LINKS view in the data dictionary to retrieve information about your database links. The output from your query should look similar to what you see below. You will need to set your linesize to 132 and format the DB_LINK and HOST columns to be only 25 bytes wide to get the same format that you see.
DB_LINK USERNAME HOST CREATED
------------------------- ------------------------------ ------------------------- ---------
DB1000_MIAMI MIAMI_USER miami 09-DEC-08STEP 2: Testing your Database Links
Each of your remote databases has an employee data table. The tables are named SEATTLE_EMP and MIAMI_EMP respective to the database they are in. Using the appropriate database link, query each of the two tables to retrieve the employee number, name, job function, and salary. (HINT: you can issue a DESC command on each of the distributed tables to find out the actual column names just like you would for a table in your own instance.STEP 3: Connecting Data in the Seattle Database
Write a query that will retrieve all employees from the Seattle region who are salespeople working in the marketing department. Show the employee number, name, job function, salary, and department name (HINT: The department name is in the DEPT table) in the result set.STEP 4: Connecting Data in the Miami Database
Write a query that will retrieve all employees from the Miami region who work in the accounting department. Show the employee number, name, job function, salary, and department name (HINT: The department name is in the DEPT table) in the results set.STEP 5: Connecting Data in all Three Databases
Now we need to increase our report. Write a query that will retrieve employees from both the Seattle and Miami regions who work in sales. Show the employee number, employee name, job function, salary and location name in the result set (HINT: The location name is in the DEPT table).STEP 6: Improving Data Retrieval from all Three Databases
Writing queries like the ones above can be fairly cumbersome. It would be much better to be able to pull this type of data as though it was coming from a single table, and in fact this can be done by creating a view.- Using the query written above as a guide, write and execute the SQL statement that will create a view that will show all employees in both the Seattle and Miami regions (you can use your own naming convention for the view name). Show all the employee number, name, job, salary, commission, department number and location name for each employee (HINT: The location name is in the DEPT table).
- Now write a query that will retrieve all the data from the view just created.
Deliverables
Learn More
Submit your completed Lab 3 Report to the Dropbox. Your report should contain copies of each query and result set outlined in the lab along with the requested explanation of whether or not it satisfied the business requirement outlined for that particular section of the lab.
6 Item(s)
Grid List

You have no items in your shopping cart.
